





When a Mercedes-Benz truck throws up a warning light on the dash, getting to the bottom of it quickly is what separates a productive workshop from one that’s haemorrhaging downtime. This step-by-step guide walks you through reading fault codes on a Mercedes-Benz HGV — in this example, an Actros MP4 — using Jaltest Diagnostics. The workflow applies broadly across the Mercedes-Benz commercial vehicle range, so even if your vehicle is a different model, you’ll find the process largely consistent.
What You’ll Need Before You Start
Before connecting to the vehicle, make sure you have the following to hand:
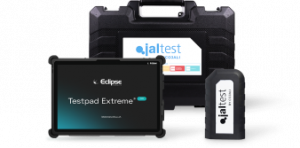
- A Jaltest CV diagnostic kit (including the Testpad Extreme Pro tablet)
- The correct diagnostic cable for Mercedes-Benz — in this case, a JDC213.9 standard 16-pin EOBD cable
- The vehicle’s VIN (useful for confirming the correct model selection in Jaltest)
If you’re not yet set up with Jaltest and want to find out what’s included in a Jaltest CV package from Eclipse, our team can advise on the right configuration for your workshop.
Step 1: Connect to the Vehicle and Identify the Make and Model
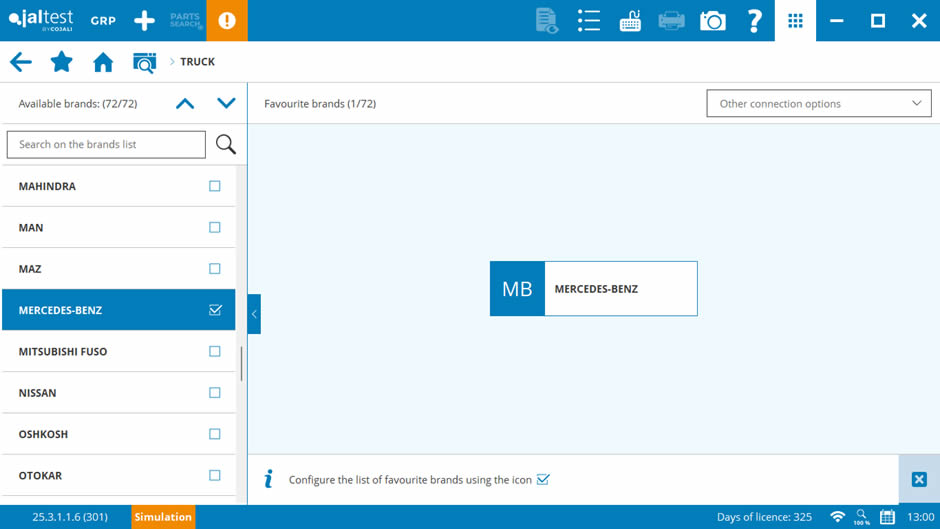
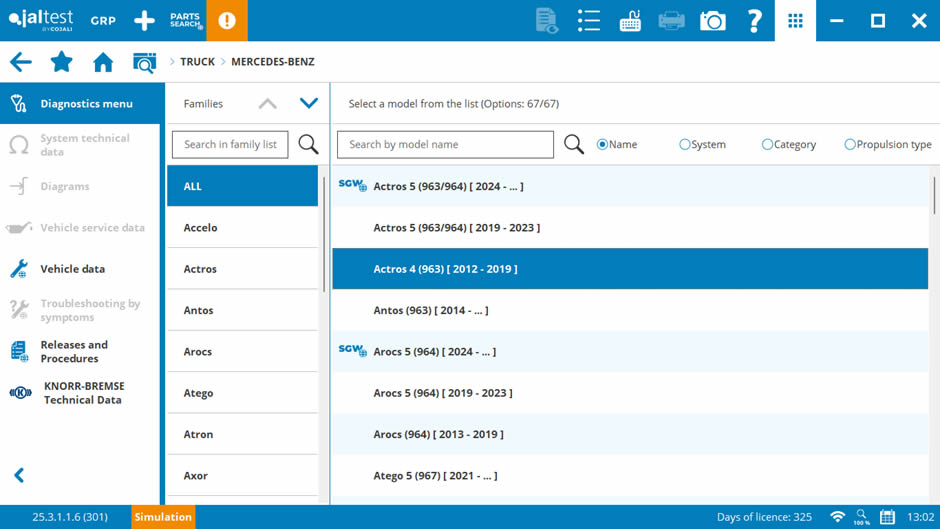
Open Jaltest Diagnostics and navigate to Truck, then select Mercedes-Benz. From there, choose the correct model family. In today’s example, the vehicle is an Actros MP4, so we select Actros 4.
To help confirm you’ve selected the right variant, Jaltest displays the 4th, 5th, and 6th digits of the VIN alongside each model option. For example, a VIN containing 934 in those positions confirms the Actros 4 selection. This is a handy way to avoid connecting to the wrong ECU architecture, which can cause confusion when fault codes don’t match what you’re seeing on the dash.
Step 2: Identify the Correct Diagnostic Socket and Cable
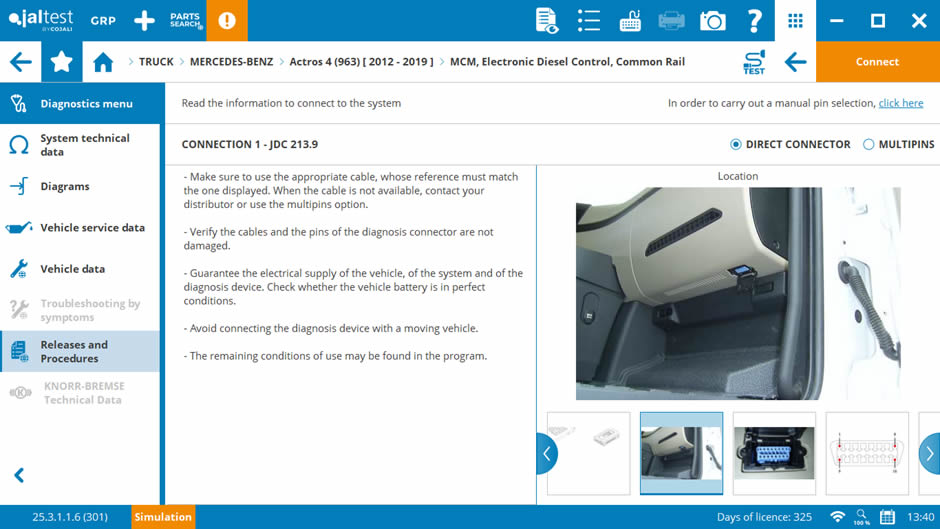
Once the model is confirmed, Jaltest will indicate which diagnostic socket to use and where it is located on the vehicle. This saves time when you’re unfamiliar with the layout of a particular cab.
In this instance, the correct connection is the JDC213.9 standard 16-pin EOBD socket. Locate it on the vehicle, connect your cable, and Jaltest will begin communicating with the truck’s ECUs.

Step 3: Choose Your Diagnostic Approach — System Scan or Targeted ECU
At this point, Jaltest gives you a choice depending on the nature of the job:
- System scan: Runs a scan across all ECUs simultaneously. Ideal for general fault-tracing, pre-MOT inspections, or when you’re not certain which system is at fault.
- Targeted ECU: Connects directly to a single system, such as the engine, transmission, or aftertreatment. Best used when you already know where the fault lies.
Running a full system scan will return all stored faults across every ECU on the vehicle in one go, which gives you a useful overview before you start digging into individual systems.
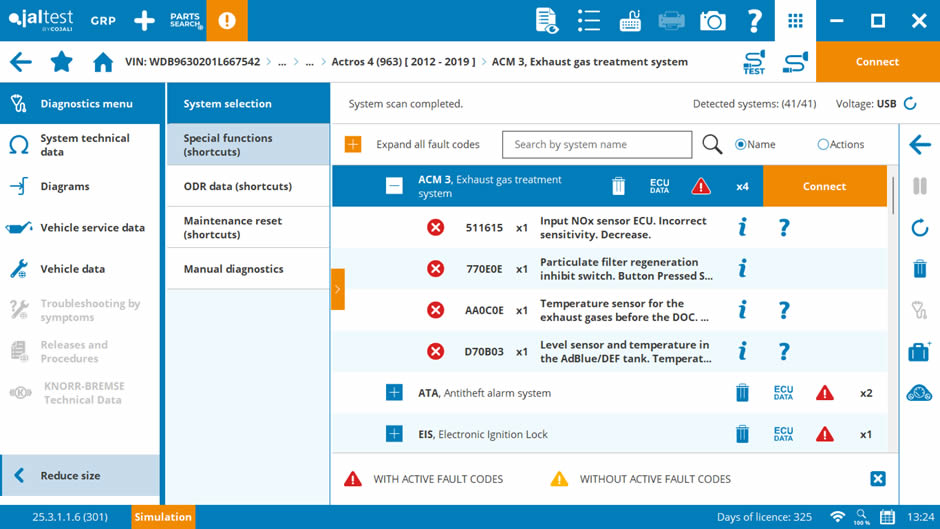
In today’s example, we have an engine warning light showing on the dashboard, so we’re going to connect directly to the engine ECU to keep things focused. To narrow the list down, untick All in the system selector and tick Engine only.
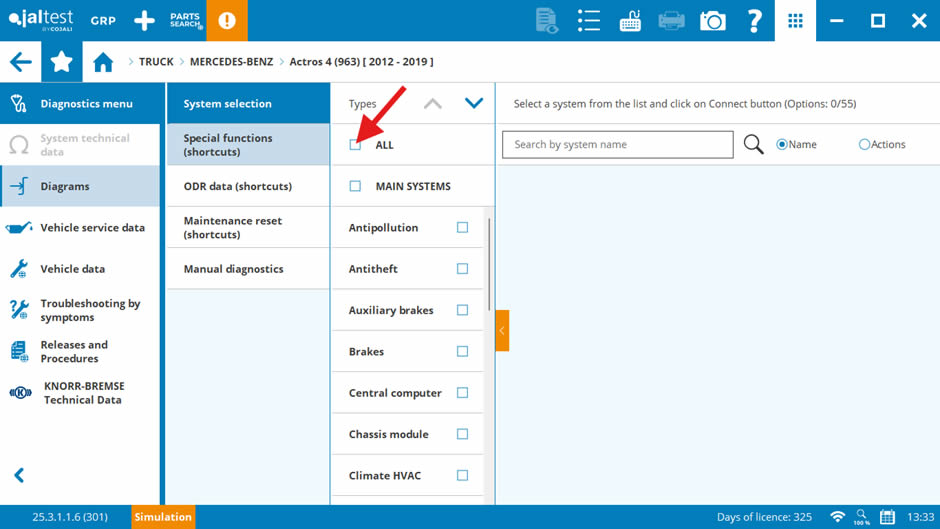
This reduces the list significantly and makes it easier to locate the correct ECU.
The Actros MP4 in this example is fitted with a common rail engine, so we select MCM (Motor Control Module). If you’re unsure which ECU to choose, running the full engine scan first is always a safe option.
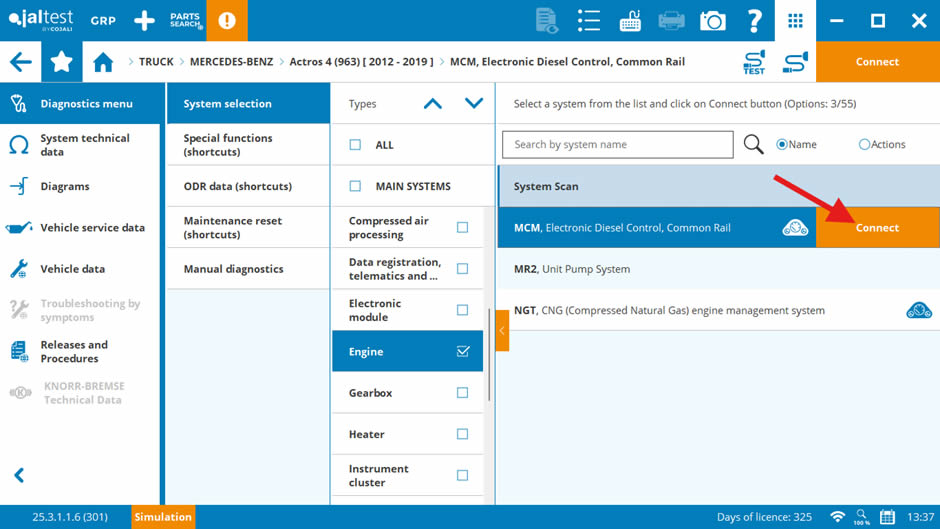
Step 4: Enter Fault Code Reading
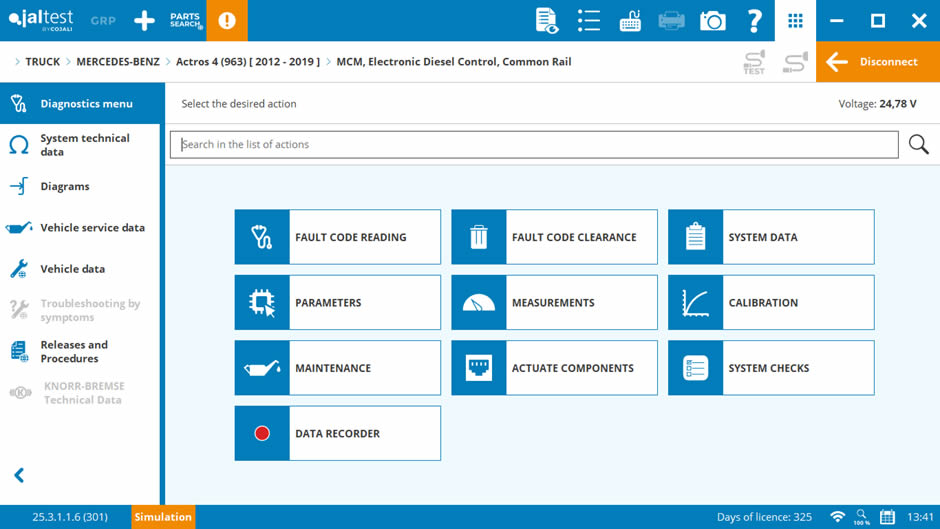
Once connected to the MCM, the main diagnostics menu will appear. From here, select Fault Code Reading.
Jaltest will retrieve all stored fault codes from the ECU. In this particular vehicle, there are quite a few — which isn’t unusual on a truck that’s been running with an unresolved issue for some time.
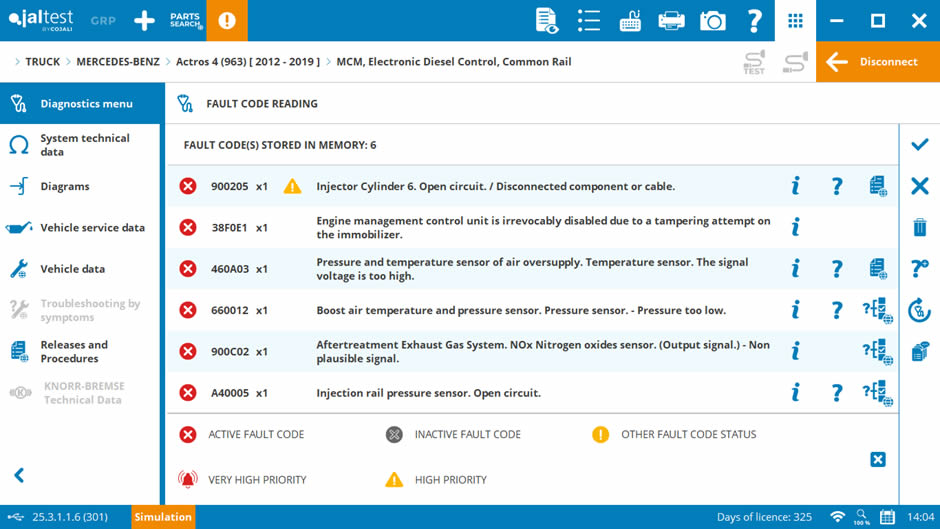
Step 5: Understand the Fault Code Colour Coding
Jaltest uses a colour-coded system to indicate the status of each fault code at a glance:
- Red — Active fault. The fault is currently present and confirmed.
- Grey — Inactive fault. The fault has been recorded but is not currently active.
- Yellow — Intermittent fault. The fault has occurred but may not be consistently reproducible.
It’s important not to dismiss grey faults simply because they’re inactive. An inactive fault that occurred recently may still point to an underlying problem that needs attention. This is where Freeze Frame data becomes invaluable.
Step 6: Use Freeze Frame Data to Establish When a Fault Occurred
Selecting a fault and accessing its Freeze Frame data gives you a timestamp showing when the fault was logged. Jaltest displays this information as:
- Date and time of the fault event
- Operating hours at the time of the fault
- Distance (odometer reading) at the time of the fault
This allows you to establish context. If a fault shows as grey (inactive) but the Freeze Frame confirms it occurred within the last few days or hours, it warrants investigation — regardless of its current status.
Step 7: Access Detailed Fault Code Information
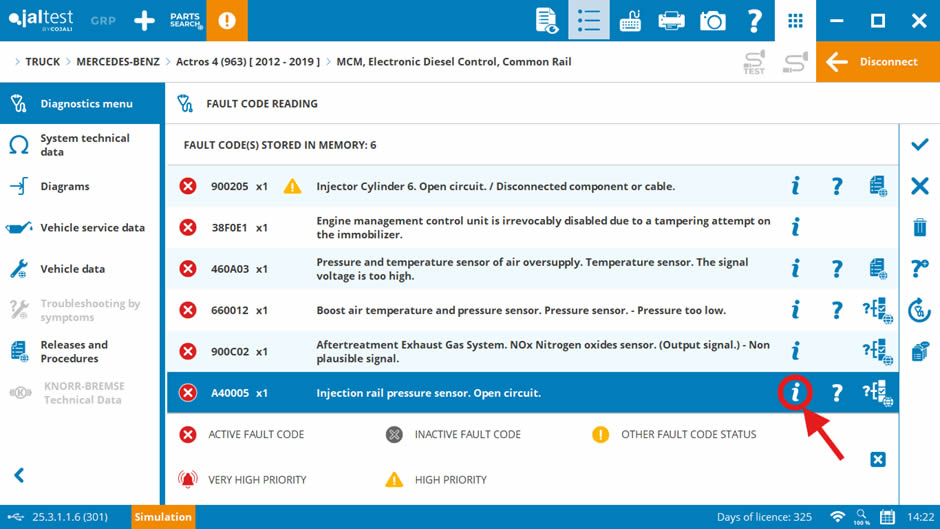
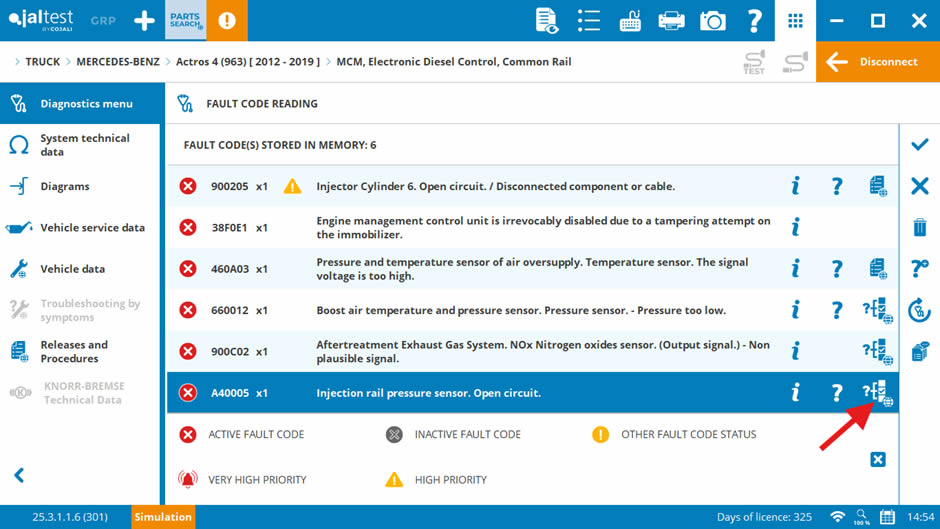
Selecting a fault code brings up further detail about that specific issue. In this example, we’re looking at a fault relating to the pressure sensor on the common rail system.
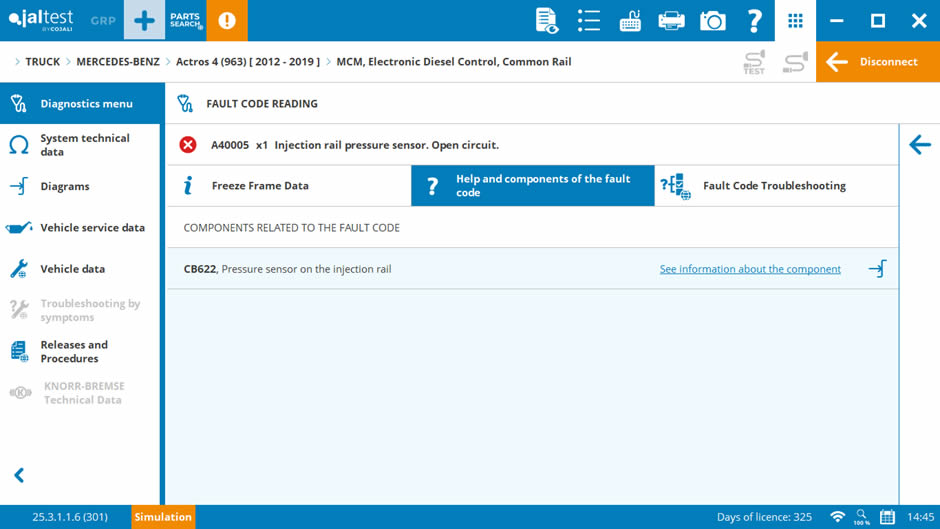
Tapping the question mark icon opens additional information about the fault — including reference values, component descriptions, and possible causes. This is one of the features that makes Jaltest CV stand out as a workshop tool: rather than leaving the technician to interpret a bare fault code, it provides meaningful context that speeds up diagnosis considerably.
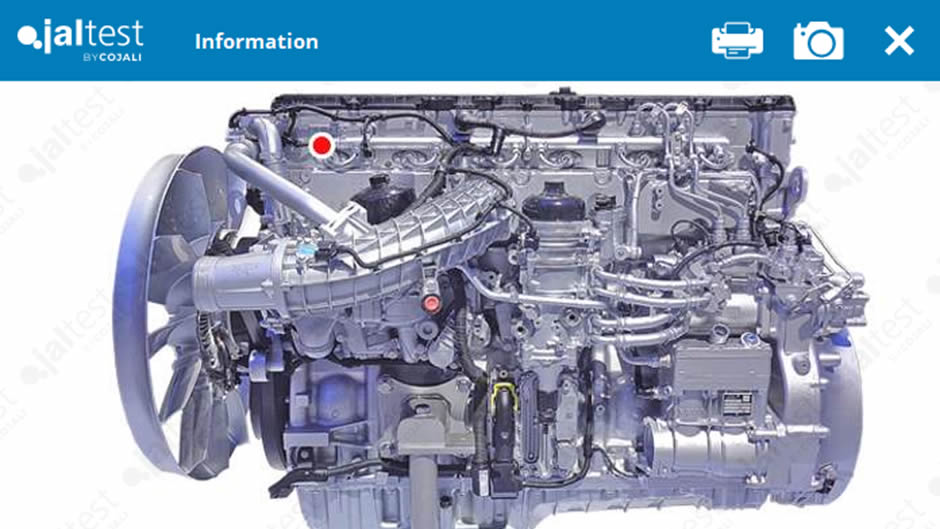
Step 8: Access Wiring Diagrams and Component Data
Jaltest also provides access to the block wiring information for the affected system directly from within the fault code screen. This means you can check circuit integrity without leaving the diagnostic workflow to hunt through paper schematics or separate databases.
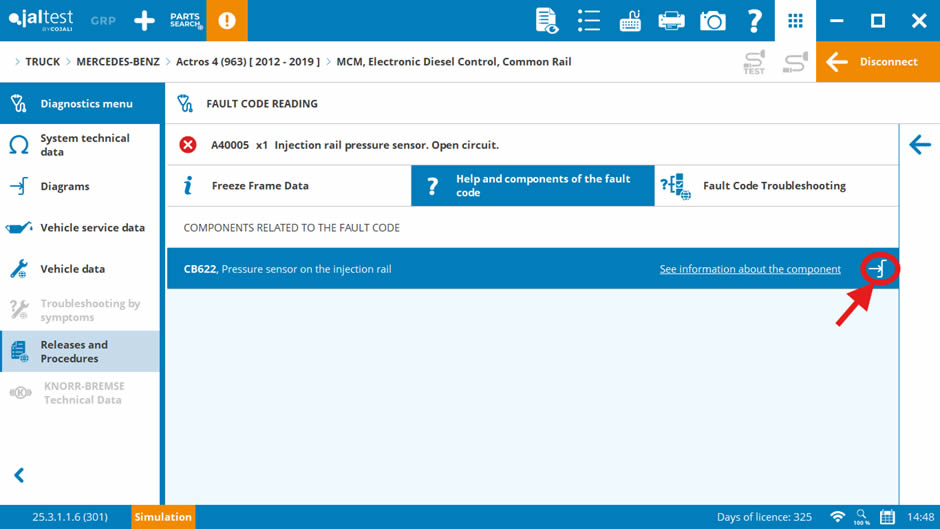
In this case, we can quickly check the wiring on the pressure sensor for an open circuit. Double-clicking on an individual component within the wiring view loads additional data for that component, including pin data — extremely useful when you need to verify signal voltages or resistance values at the connector.
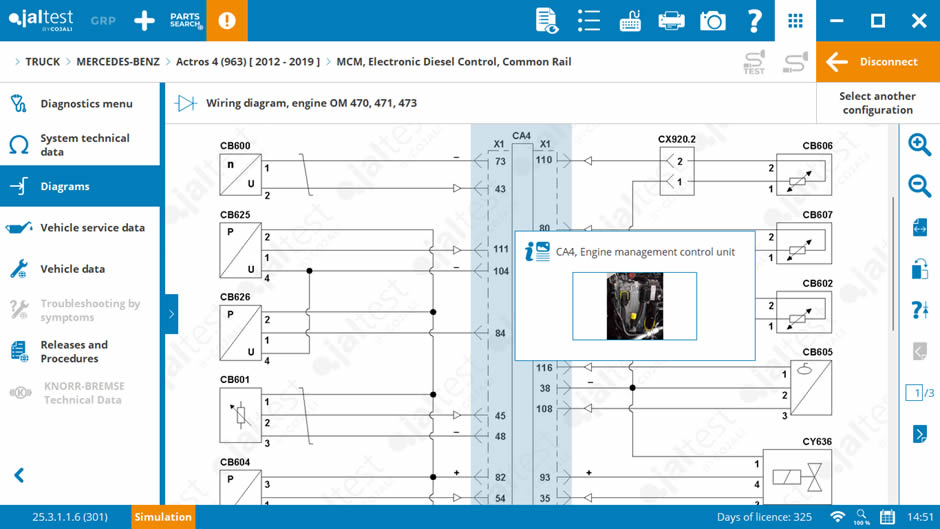
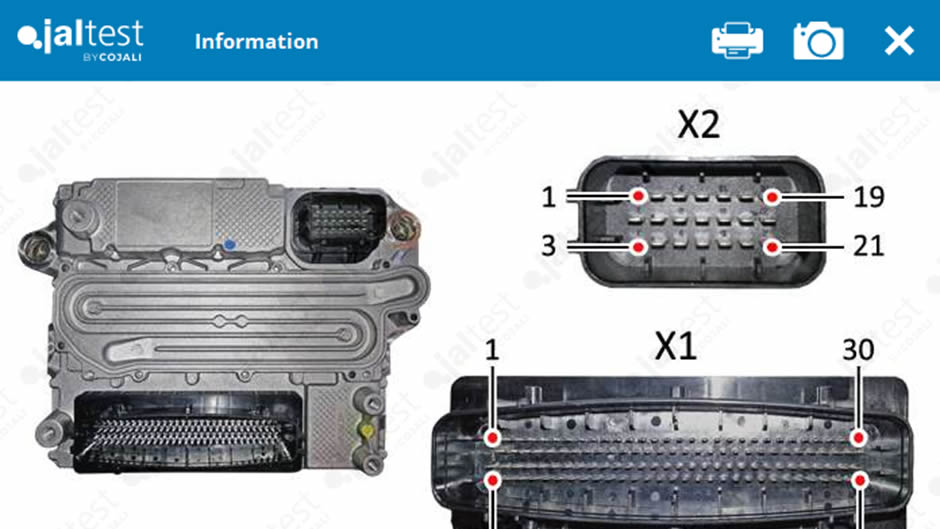
When you’re done reviewing the wiring information, simply click Diagrams again to return to the fault code screen.
Step 9: Use the Smart Troubleshooting Guides
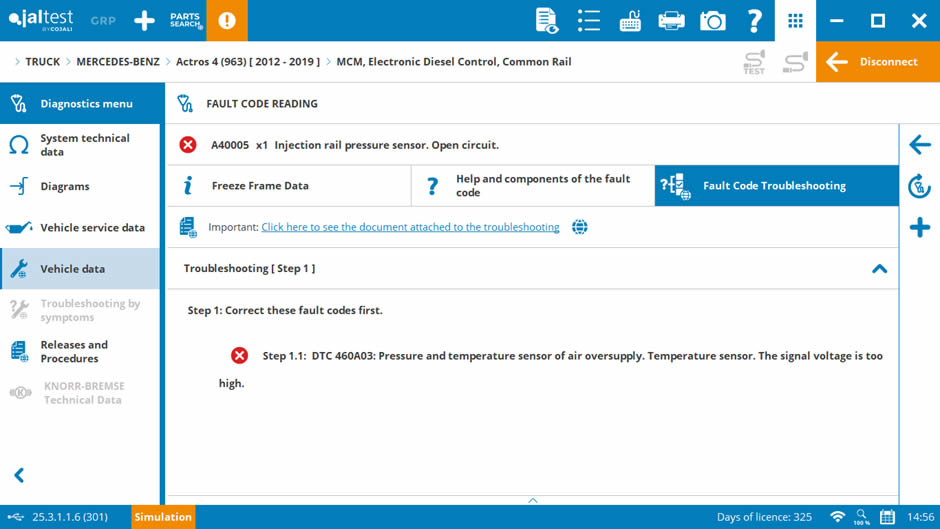
Alongside the wiring information, Jaltest provides access to troubleshooting guides directly linked to the fault code you’re investigating. These aren’t static PDFs — they are interactive smart guides that walk you through a structured diagnostic process step by step.
The smart guide in this example first directs the technician to address another related fault in the system before proceeding — a logical sequence that prevents wasted effort diagnosing downstream symptoms before a root cause has been resolved.
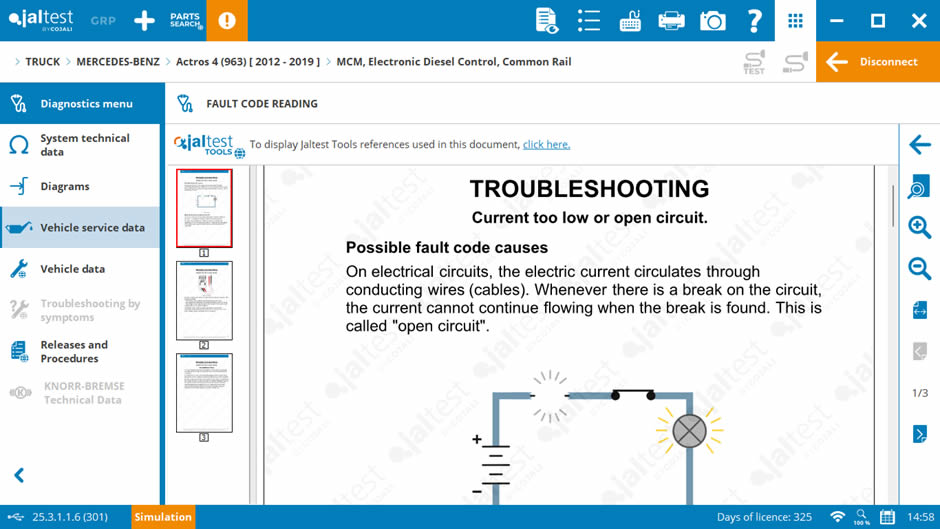
Jaltest also provides access to additional technical documents associated with the specific fault code — further reference material to support an accurate diagnosis.
Step 10: Clear the Fault Codes
Once the underlying fault has been identified and rectified, you can clear the stored codes from the ECU. In Jaltest, this is done by clicking the bin (delete) icon on the fault code screen. This clears the fault from the ECU’s memory.
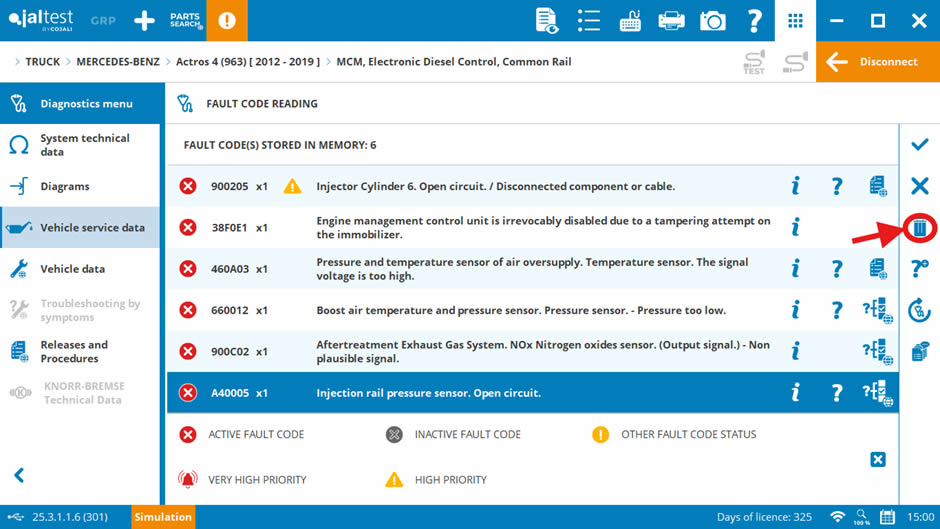
It’s worth noting that some fault codes — particularly those with legal or emissions implications — have a mandatory retention period and cannot be cleared immediately. Jaltest will indicate if this applies.
Step 11: Verify the Repair Using Live Data
Clearing fault codes is not the final step — you should always verify that the repair has been effective before returning the vehicle to service. Using Jaltest’s measurements (live data) function, you can monitor the sensor or system that was at fault in real time.
In this example, checking the common rail pressure sensor shows two readings that should correspond. When both values match, it confirms the sensor and its circuit are operating correctly.
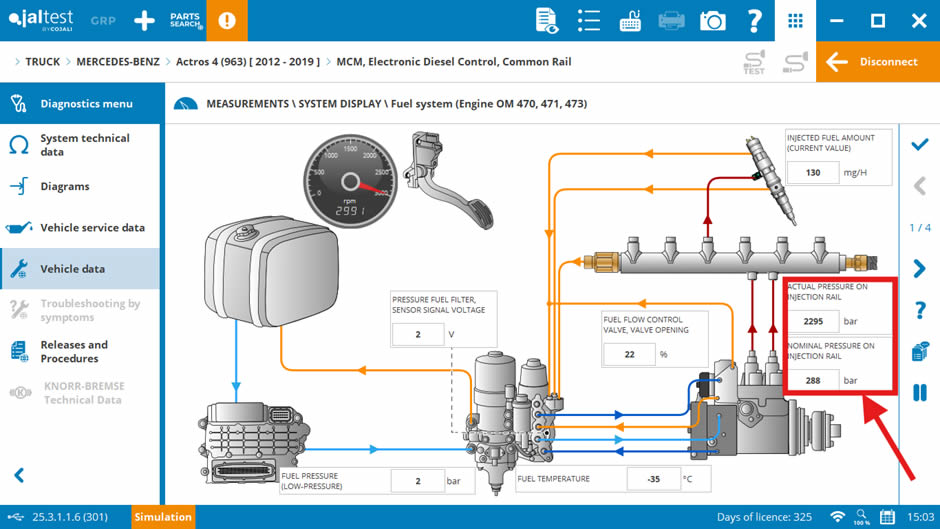
This final check gives you — and your customer — confidence that the issue has been fully resolved rather than simply hidden by a code clear.
Summary
Reading Mercedes-Benz fault codes with Jaltest Diagnostics is a straightforward process once you’re familiar with the workflow. The ability to move seamlessly from fault code reading into wiring diagrams, component data, freeze frame history, and interactive troubleshooting guides — all within the same software — is what makes Jaltest a genuinely powerful tool for independent workshops and fleet maintenance teams alike.
Whether you’re dealing with a straightforward active fault or tracking down an intermittent issue that’s been lurking in the background, Jaltest gives you the information and structure to diagnose with confidence.
Eclipse supplies and supports Jaltest Diagnostics across the UK. If you’d like to find out more about adding Mercedes-Benz coverage to your workshop — or upgrading your existing diagnostic setup — visit our HGV diagnostics page or get in touch with the Eclipse team directly.