


If you run artics, rigids or trailers in the UK, you feel downtime in your bones: missed slots, empty miles, drivers sitting, customers phoning. But how many vehicles are actually off the road (VOR) at any one time — and what does that translate to in real money? Here’s a data-led look, plus practical ways Jaltest diagnostics can claw back both time and cash.
The size of the UK HGV fleet (so we can size the problem)
The latest government figures put the number of licensed HGVs at ~534,000 in 2024 (published July 2025). GOV.UK
The RAC Foundation summarises the same picture: ~0.53 million HGVs on UK roads at the end of 2024. racfoundation.org
Trailers aren’t licensed in the same way, so there’s no single “parc size” published. However, the DVSA’s testing data gives a sense of scale: ~65,000 trailer MOTs per quarter (c. 260k/yr) with final fail rates typically ~6–7% — which also hints at the maintenance load trailers generate.
How many are off the road right now?
No regulator publishes a live VOR percentage. In practice though, large fleets aim for <5% VOR. Asda publicly quoted cutting its VOR to “less than 5%” through proactive maintenance and tight supplier control, which would seem to be a realistic industry benchmark.
If we apply a 5–10% VOR range to the current HGV parc:
- 5% VOR ⇒ ~26,700 HGVs off road at any moment
- 10% VOR ⇒ ~53,400 HGVs off road
Those are conservative-to-stretch estimates intended for planning — but they align with what many UK transport teams quietly work to internally. (For trailers, apply similar percentages to your own inventory because there’s no official national trailer count.)
Why has VOR crept up since 2020?
Independent workshop-platform data shows average “vehicle-off-road” times per job rose post-pandemic (supply chain, workshop capacity), with typical VOR durations ~1.6–1.9 days in recent years for fleet vehicles. In addition, data shows that unplanned repairs hit roughly every 10 weeks for commercial vehicles, meaning frequent interruptions even in well-run fleets.
The bill: what does a VOR day cost?
Credible UK references gathered over the past two years suggest the following cost estimates:
- £700–£800 per day (Northgate/Webfleet analysis of UK fleets; LCV-focused, but indicative of lost productive value).
- Around £727 per day (BVRLA-referenced figure reported in 2025).
- £3,000–£4,000 per day for some heavy operations (civil engineering/utilities) once knock-on costs are counted.
In addition, warranty/repair data shows average HGV repair invoices rose to £1,772 in 2025 (+11.8% YoY) — before lost revenue is taken into consideration.
A quick scenario
At a mid-range £800 per VOR day, if around 26,700 HGVs are parked up (the 5% case), that’s in the region of £21.4m per day in lost productive value across the sector.
What’s actually going wrong? The defects that sideline HGVs and trailers
Official Government data sources reveal the following patterns:
1) What fails at annual test (MOT equivalents)
Quarterly DVSA data shows initial fail rates typically around 9–12% for HGVs and ~8–9% for trailers, improving to ~6–8% after on-site rectification — still a big maintenance churn.
2) What triggers prohibitions at the roadside
DVSA enforcement stats consistently put these near the top for HGVs:
- Tyres (condition) — the standout category every quarter
- Brake systems & components (including service brake operation)
- Lighting & indicators, steering mechanism, exhaust emissions, suspension, body/security
Example (Oct–Dec 2024): Tyres – 6.5% of all vehicles inspected had a tyre-related prohibition; Brakes – ~2.0%; indicators, lamps, steering, emissions each – ~1–2%.
These patterns mirror what workshops see: tyres, brakes and lights create high volumes of defects; brake performance and steering/suspension defects often need more hours and parts; emissions/aftertreatment (DPF/SCR/AdBlue) faults can be time-consuming to diagnose and clear.
Faults that keep vehicles off the road the longest
Beyond the defect itself, parts and labour availability remain the bottleneck. Connected-maintenance platforms report unscheduled VOR days due to parts delays averaging ~11 days in 2023 (down from 16 in 2022) — still painfully high. At the same time, technician availability has also been a multi-day drag on repair times.
The trailer story
Trailers fail less often at test than tractors, but the absolute volume is massive (c. 260k tests/year, final fail ~6–7%), and EBS/ABS modulators, air suspension components, tyres, lighting, and brake performance are all frequent culprits. Prices vary, but EBS modulators alone commonly sit ~£500–£1,000+ for parts (before labour and retest logistics).
What this costs a typical operator
Let’s say you run 120 tractors and 250 trailers:
- If you hold VOR at 4% on tractors (good going), that’s ~5 trucks down on any given day.
- At £800/day in lost contribution: ~£4,000/day, ~£1.0m/year if persistent throughout the entire year.
- Add trailers: even if only 2–3% are VOR, call it 5–8 trailers awaiting parts/tests/tyres — which blocks routes or reduces utilisation.
Of course, your own numbers may be higher or lower, but the headline is the same: downtime is a seven-figure line item for mid-size fleets.
How Jaltest diagnostics shortens the pain window
Every VOR day has two clocks: time-to-diagnose and time-to-fix. You have more control over the first one, but Jaltest can actually help with both.
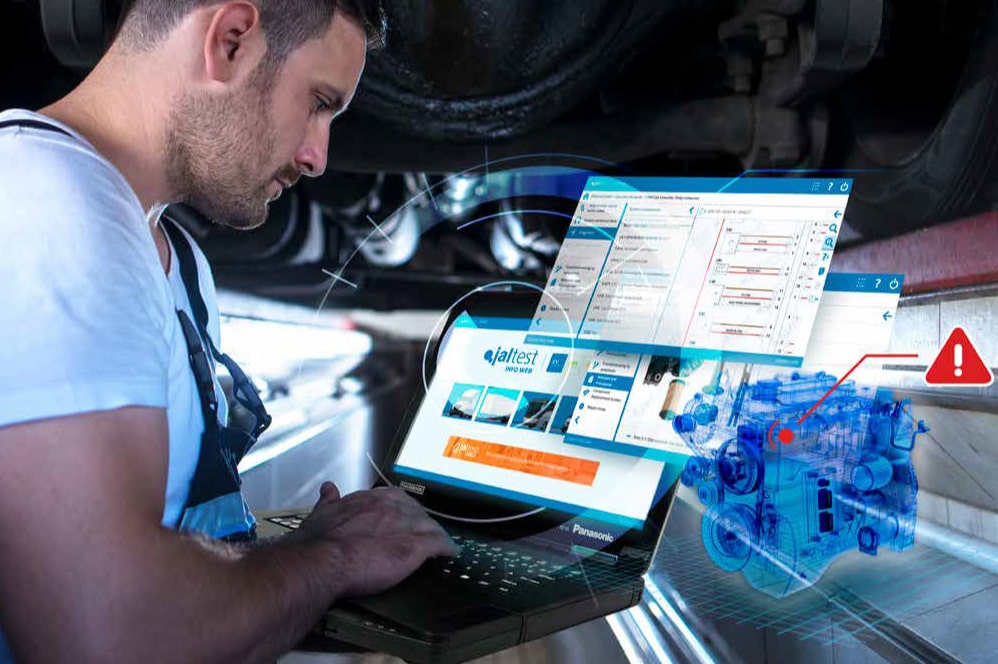
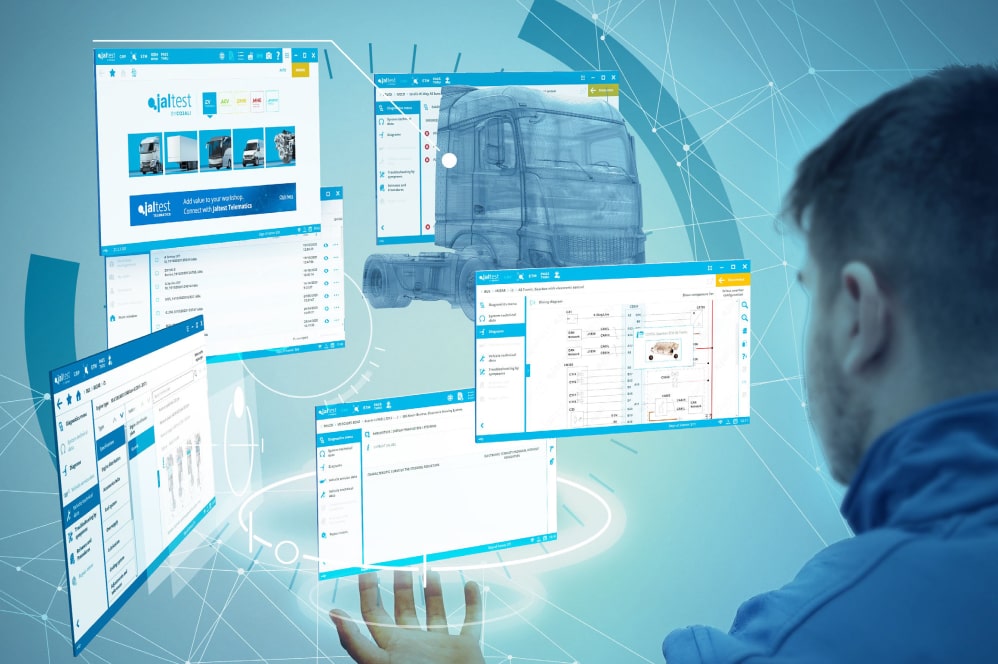
Multi-brand commercial-vehicle diagnostics like Jaltest collapse the diagnostic and repair cycle with:
- Guided fault trees & step-by-step troubleshooting, so techs move from fault code to fix with less trial-and-error.
- Interactive wiring diagrams, component locations, test values and OEM torque/spec data inside the software — no more hunting PDFs.
- Dealer-level functions across multiple makes and systems from one tool: DPF regens, EGR/SCR tests, calibrations, cylinder cut-out, parameter changes, EBS/EBS trailer diagnostics, and more.
- Regular coverage updates (new models/systems), keeping the kit current as your fleet mix evolves.
Where the savings actually show up
1. Minutes-to-hours per job: Faster root-cause = quicker authorisations, earlier parts ordering, fewer reworks.
2. Fewer NFFs (no fault found): Guided tests reduce guesswork and parts darts.
3. Trailer uptime: Proper EBS/ABS live data and calibrations stop the “swap the ECU and hope” routine that burns days.
4. First-time pass at DVSA: Using live brake performance data and proper pre-MOT checks reduces retests (remember, HGV final fail rates are ~6–8% each quarter).
Even shaving 0.5 day off each unplanned event pays back quickly. If you see an unplanned workshop visit every ~10 weeks per unit, the hours saved compound across the year.
Practical actions to cut your VOR — this quarter
- Measure VOR properly (planned vs unplanned); weekly review by depot/asset class. (Plenty of fleets still don’t — and what isn’t measured won’t shrink.)
- Target <5% VOR as a KPI (it’s achievable with focus).
- Exploit Jaltest diagnostics for guided repair and maintenance.
- Parts strategy: Stock your A-class fast movers (tyre sizes, lamps, brake chambers, EBS modulators), and lock in SLAs with suppliers — parts delays averaged ~11 days for unscheduled events in 2023; don’t accept that.
- Close the trailer gap: Give trailers the same diagnostic love as tractors. EBS/ABS live data and calibrations will pay back on reduced roadside grief and faster test passes.
Bottom line
At a conservative 5% VOR, tens of thousands of UK trucks are idle right now — burning £20m+ per day in lost productive value. The big, fixable chunk is diagnostic time and accuracy – get to root cause faster using Jaltest.